We can use multiple metrics to evaluate depth quality. It is recommended to use a universal scene compatible with all tests, such as a smooth, flat, matte, uniformly parallel-aligned plane for the depth camera, placed at a controlled and known distance during testing. A white or light-colored board mounted on a rigid frame or structure is a suitable target. The accuracy and precision of depth data (also known as temporal noise or repeatability) are the main characteristics for judging the image quality of a depth camera. For details, please refer to “TN01-Understanding accuracy vs. precision : What are their differences?“. This article introduces the depth quality testing of the DS series time of flight cameras.
Table of Contents
DS series products
The Vzense DS series includes two products, the DS86 and DS87, which are developed with Sony’s latest Continuous Wave iToF(CW-iToF) technology, the IMX570, for CW-iToF cameras. The DS series cameras offer high data stability, high resolution, and high accuracy and precision, and they support the customization of wide-angle lenses, providing stronger light resistance outdoors and adaptability to outdoor scenes. The cameras are designed to industrial grade standards, ensuring high reliability and stability. The bidirectional mounting hole design facilitates structural integration and fixation of the buttom camera. The optional aviation plug waterproof design supports a high protection level of IP67.
Testing conditions
Target object: A 80cm x 80cm gray calibration board with 40% planar reflectance, mounted on a pole connected to the motion platform. As shown in the figure below:
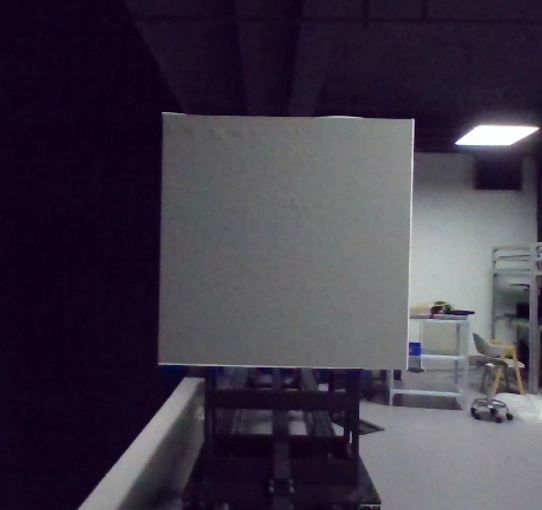
Camera testing: Randomly select 3 calibrated DS86 cameras. During calibration, use an 80cm x 80cm gray calibration board with 40% planar reflectance. The imaging performance of the DS87 is identical to that of the DS86, so the performance of the DS86 can represent that of the DS87.
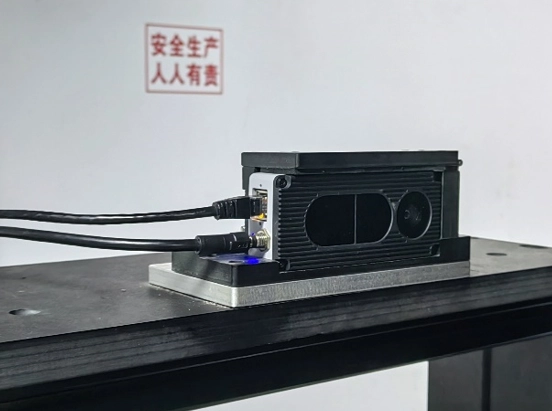
Camera position: Mounted on a steel fixture, with the lens surface parallel to the calibration board surface. As shown in the figure below:
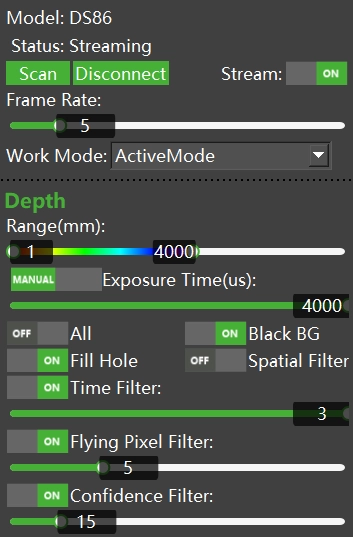
Camera settings: Default settings, as shown in the figure below, camera preheated for 20 minutes.
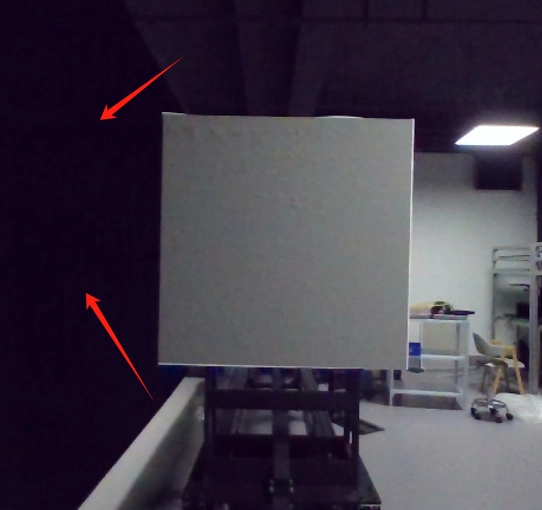
Imaging environment: Room temperature of 22°C, indoor lighting at 200lux during the test, with black curtains used on one side to minimize surrounding reflections. As shown in the figure below:
Testing platform: Linear guide motion platform, with a platform accuracy and precision of 1mm.
The motion platform moves from 0.5m to 5m, stopping at 0.5m, 1m, 1.5m, 2m, 2.5m, 3m, 3.5m, 4m, 4.5m and 5m. At each step, measure the depth in the 10×10 pixel region of interest (ROI) at the center of the image, and repeat 32 times to obtain the average value.
Testing method: Use our self-developed tools to measure and record depth metrics in real-time. For accuracy depth value assessment, we use the average depth of each pixel in the image set. For precision depth value assessment, we calculate the standard deviation between each pixel in the image set.
Accuracy testing
In order to obtain the most accurate results possible, the 3D time of flight cameras calibration and testing in the factory to ensure reliable accuracy. The DS series cameras are calibrated for a measurement range of 0.15 to 5 meters. Based on the test conditions mentioned above, the measurement errors for the three sets of data at different distances are shown in the table below. According to the actual test results, the measurement errors are generally maintained at millimeter-level accuracy, with an accuracy < 1%.
Accuracy trend at different distances, as shown in the figure below. The accuracy of the depth of the DS series cameras decreases as the distance increases.
Precision testing
Precision measures the variations in depth values over a specific number of frames, also known as temporal noise or repeatability. The purpose of precision measurement is to understand the correlation of each pixel’s Z-axis precision of the depth camera at the same exposure time. It is measured on a per-pixel basis, and then the average or median of the ROI is taken as the precision data of the standard deviation of the depth values. According to the actual test results, the measurement error is generally maintained at millimeter-level precision, with precision < 5‰.
Relationship between precision and distance
The depth quality test data trend with an exposure time of 1ms is shown in the figure below. The precision of the depth values of the DS series cameras decreases as the distance increases.
Relationship between precision and exposure time
To help users understand the factors affecting precison, we tested the precision of different exposure time settings (1ms, 2ms, 3ms, and 4ms) at each distance. The data below indicates that the longer the exposure time set on the camera, the higher precision the camera can get, as long as images are not saturation.
Test results
The table below shows the depth quality test results for three sets of DS86 cameras based on the above testing conditions.
Camera A test results are as follows:
| Test No. | True value (mm) | Measured value (mm) | Measured accuracy error value (mm) | Accuracy (%) | Measured precision error value (mm) | Precision (%) |
| 1 | 500 | 498 | -2 | -0.40% | 1.7 | 0.34% |
| 2 | 1000 | 995 | -5 | -0.50% | 2.0 | 0.20% |
| 3 | 1500 | 1496 | -4 | -0.27% | 2.4 | 0.16% |
| 4 | 2000 | 1997 | -3 | -0.15% | 3.9 | 0.19% |
| 5 | 2500 | 2495 | -5 | -0.20% | 5.8 | 0.23% |
| 6 | 3000 | 2991 | -9 | -0.30% | 6.3 | 0.21% |
| 7 | 3500 | 3491 | -9 | -0.26% | 11.2 | 0.32% |
| 8 | 4000 | 4016 | 16 | 0.40% | 17.5 | 0.43% |
| 9 | 4500 | 4486 | -14 | -0.31% | 21.3 | 0.47% |
| 10 | 5000 | 4988 | -12 | -0.24% | 23.5 | 0.47% |
Camera B test results are as follows:
| Test No. | True value (mm) | Measured value (mm) | Measured accuracy error value (mm) | Accuracy (%) | Measured precision error value (mm) | Precision (%) |
| 1 | 500 | 503 | 3 | 0.60% | 1.4 | 0.27% |
| 2 | 1000 | 997 | -3 | -0.30% | 2.1 | 0.21% |
| 3 | 1500 | 1498 | -2 | -0.13% | 2.5 | 0.16% |
| 4 | 2000 | 1994 | -6 | -0.30% | 4.1 | 0.20% |
| 5 | 2500 | 2505 | 5 | 0.20% | 5.3 | 0.21% |
| 6 | 3000 | 3006 | 6 | 0.20% | 6.5 | 0.21% |
| 7 | 3500 | 3498 | -2 | -0.06% | 10.9 | 0.31% |
| 8 | 4000 | 4012 | 12 | 0.30% | 18.3 | 0.45% |
| 9 | 4500 | 4492 | -8 | -0.18% | 22.0 | 0.48% |
| 10 | 5000 | 4990 | -10 | -0.20% | 22.3 | 0.44% |
Camera C test results are as follows:
| Test No. | True value (mm) | Measured value (mm) | Measured accuracy error value (mm) | Accuracy (%) | Measured precision error value (mm) | Precision (%) |
| 1 | 500 | 496 | -4 | -0.80% | 1.4 | 0.28% |
| 2 | 1000 | 998 | -2 | -0.20% | 2.1 | 0.21% |
| 3 | 1500 | 1501 | 1 | 0.07% | 2.5 | 0.16% |
| 4 | 2000 | 1999 | -1 | -0.05% | 4.1 | 0.20% |
| 5 | 2500 | 2508 | 8 | 0.32% | 5.3 | 0.21% |
| 6 | 3000 | 2997 | -3 | -0.10% | 6.5 | 0.21% |
| 7 | 3500 | 3496 | -4 | -0.11% | 10.9 | 0.31% |
| 8 | 4000 | 4012 | 12 | 0.30% | 18.3 | 0.45% |
| 9 | 4500 | 4511 | 11 | 0.24% | 22.0 | 0.48% |
| 10 | 5000 | 5013 | 13 | 0.25% | 23.8 | 0.47% |


